
Coumarin in Cinnamon-Containing Foods and Vanilla Extracts - April 1, 2014 to March 31, 2015
Food chemistry - Targeted surveys - Final report
Summary
Targeted surveys provide information on potential food hazards and enhance the Canadian Food Inspection Agency's (CFIA's) routine monitoring programs. These surveys provide evidence regarding the safety of the food supply, identify potential emerging hazards, and contribute new information and data to food categories where it may be limited or non-existent. They are often used by the Agency to focus surveillance on potential areas of higher risk. Surveys can also help to identify trends and provide information about how industry complies with Canadian regulations.
Coumarin is a natural compound found in plants such as cinnamon and tonka beans. Coumarin was utilized as a flavouring agent in the food and perfume industries for many years until evidence of toxicological properties and potential adverse effects on the liver led to its use in food to be discontinuedFootnote 1,Footnote 2. Low exposure to coumarin from natural sources is expected and not anticipated to represent a health risk. The CFIA considered it important to examine the coumarin levels in commonly available cinnamon-containing products and vanilla extracts to ensure that the populations consuming these foods more frequently are not being exposed to higher levels and are not at risk.
This 2014 to 2015 targeted survey on coumarin generated further baseline surveillance data on the concentration of coumarin in domestic and imported products on the Canadian market. Seven hundred and thirty-nine products were sampled and analyzed, including 148 cooking sauces, 38 dried beverage mixes, 239 cinnamon and vanilla oils and extracts, 104 spice mixes and 210 tea samples. Coumarin was detected in 63% of the samples, with levels ranging from 0.2 ppm to 2170 ppm. The highest levels were detected in spice mixes and tea samples. The average and maximum coumarin concentration in spice mixes, dried tea, and baked goods were comparable to previous targeted surveys. Comparison of the survey results to scientific literature showed that the levels of coumarin detected in Canadian retail products are similar to those reported in a variety of scientific studies.
Health Canada (HC) determined the levels of coumarin in food observed in this survey are not expected to pose a concern to human health, therefore there were no follow-up actions resulting from this survey.
What are targeted surveys
Targeted surveys are used by the CFIA to focus its surveillance activities on areas of highest health risk. The information gained from these surveys provides support for the allocation and prioritization of the Agency's activities to areas of greater concern. Originally started as a project under the Food Safety Action Plan (FSAP), targeted surveys have been embedded in our regular surveillance activities since 2013. Targeted surveys are a valuable tool for generating information on certain hazards in foods, identifying and characterizing new and emerging hazards, informing trend analysis, prompting and refining health risk assessments, highlighting potential contamination issues, as well as assessing and promoting compliance with Canadian regulations.
Food safety is a shared responsibility. We work with federal, provincial, territorial and municipal governments and provide regulatory oversight of the food industry to promote safe handling of foods throughout the food production chain. The food industry and retail sectors in Canada are responsible for the food they produce and sell, while individual consumers are responsible for the safe handling of the food they have in their possession.
Why did we conduct this survey
The main objectives of this targeted survey were to generate further baseline surveillance data on the level of coumarin in cinnamon-containing products and vanilla extracts available on the Canadian retail market, and to compare, where feasible, the prevalence of coumarin in foods targeted in this survey with that of similar products in previous targeted surveys and to the scientific literature.
Coumarin is a naturally occurring sweet-smelling compound found in many plants, including cinnamon, tonka beans, and sweet clover. High amounts of coumarin can be found in cassia cinnamon (also known as true cinnamon), whereas the Ceylon variety typically contains only traces. Ceylon cinnamon is typically more expensive than cassia cinnamon, and has a milder flavour/spice profile. Due to economics and a preference of the public for a "spicier flavour profile", most of the cinnamon sold today is cassia cinnamon.
In order to achieve a consistent flavour profile in processed foods, the use of flavouring extracts has been a common practice in the food industry. Coumarin, either naturally derived or synthetically produced, was used as a flavouring agent in the past; however, its use in food has been discontinued based on reports of adverse health effects in animal studiesFootnote 1,Footnote 2. Although the deliberate addition of coumarin to foods is not permitted in Canada, plants or herbs that are added to foods as flavours may contain naturally occurring coumarin. The primary source of naturally occurring coumarin in the human diet is cinnamonFootnote 2,Footnote 3. The vast majority of people can consume foods that naturally contain coumarin daily without adverse effects from exposure to coumarin; however, there is a small number of individuals who are sensitive to coumarin. For this coumarin-sensitive group, intake of significantly higher levels than would normally be found in food can lead to elevation of liver enzymes, and in severe cases to inflammation of the liverFootnote 1.
In 2004, the European Food Safety Authority (EFSA) established a Tolerable Daily Intake (TDI) of 0.1 mg for coumarinFootnote 4. In 2006, Germany's Federal Institute of Risk Assessment (BfR) concluded that high cinnamon consumption would result in excessive exposure, and warned against consuming excessive amounts of cassia cinnamon due to its relatively high content of coumarinFootnote 3. The Norwegian Scientific Committee for Food Safety also conducted a risk assessment and concluded that children and adults who regularly consume even moderate amounts of cinnamon may be at risk of elevated intake of coumarinFootnote 5.
Limited data is available on the occurrence of coumarin in vanilla extracts or in foods containing cinnamon. Cinnamon is a frequently used spice, and is often included in foods and beverages. It is widely used in cooking sauces, spice mixes, tea and other beverages for its unique flavourFootnote 6. Whereas, tonka beans, a natural source of coumarin, are used as substitutes for vanilla extracts. It was, therefore, considered important to examine the coumarin levels in commonly available cinnamon-containing products and vanilla extracts to ensure that the populations consuming these foods are not at risk. All the survey data was shared with HC.
What did we sample
A variety of domestic and imported cooking sauces, dried beverage mixes, cinnamon and vanilla oils and extracts, spice mixes and teas were sampled between August 1, 2014 and March 21, 2015. Samples of products were collected from local/regional retail locations located in 6 major cities across Canada. These cities encompassed 4 Canadian geographical areas: Atlantic (Halifax), Quebec (Montreal), Ontario (Toronto, Ottawa) and the West (Vancouver, and Calgary). The number of samples collected from these cities was in proportion to the relative population of the respective areas. The shelf life, storage conditions, and the cost of the food on the open market were not considered in this survey.
| Product Type | Number of domestic samples | Number of imported samples | Number of samples of unspecified Table Note a origin | Total number of samples |
|---|---|---|---|---|
| Cooking sauces | 6 | 118 | 24 | 148 |
| Dried beverage mixes | 17 | 10 | 11 | 38 |
| Oils and extracts | 28 | 64 | 147 | 239 |
| Spice mixes | 9 | 39 | 56 | 104 |
| Tea | 41 | 144 | 25 | 210 |
| Grand total | 101 | 375 | 263 | 739 |
Table Notes
- Table Note a
-
Unspecified refers to those samples for which the country of origin could not be assigned from the product label or available sample information
What analytical methods were used and how were samples assessed
Samples were analyzed by an ISO 17025 accredited food testing laboratory under contract with the Government of Canada. The analytical method cannot distinguish between deliberate addition of coumarin and naturally occurring levels. The results presented represent finished food products as sold and not as they would be consumed, whether the product sampled is considered an ingredient or requires preparation prior to consumption.
What were the survey results
The 2014 to 2015 coumarin survey involved analyzing 739 samples obtained at the Canadian retail level. Coumarin was detected in 63% of the samples. This was expected as most of the products sampled contained cinnamon, which is known to be a natural source of coumarin.
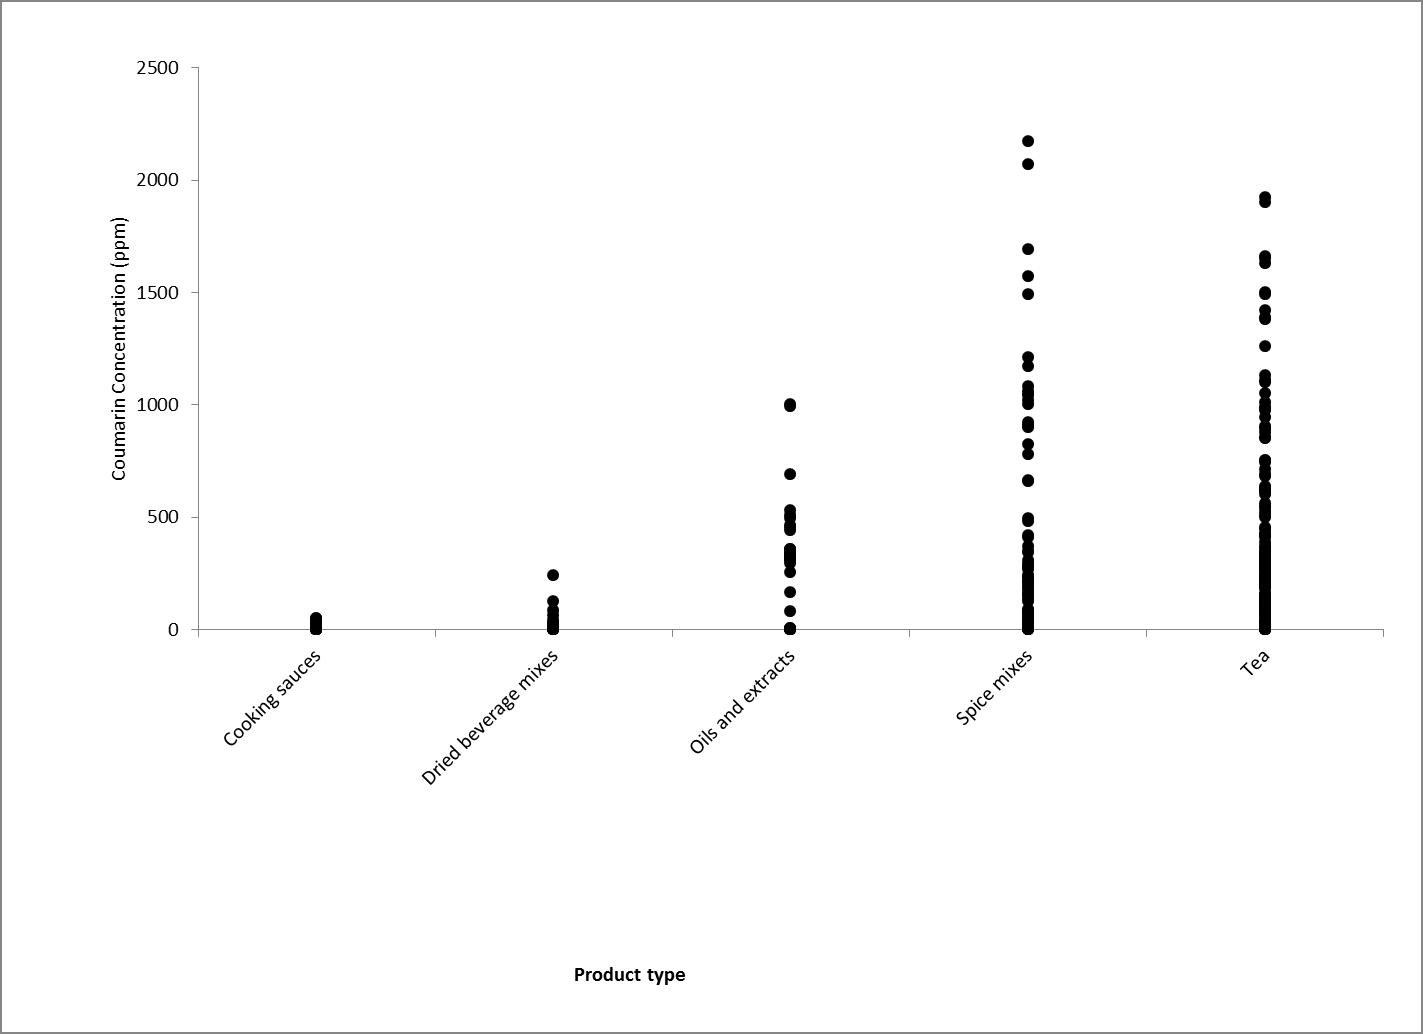
The results of this survey are summarized in Table 2. Coumarin concentrations in the survey samples ranged from 0.2 ppm to 2170 ppm. Most of the spice mix and tea samples contained detected levels of coumarin; 86% and 85% of samples, respectively. These commodities also had the highest average levels of products tested; spice mixes averaging 329 ppm and tea at 302 ppm, as well as, the highest levels of coumarin found in individual samples. Pumpkin spice mix and Chinese five-spice mix samples had the highest average content of coumarin, which is expected as these types of spices often have high content of cinnamon, up to 70%. Herbal tea contained the highest levels of coumarin in comparison to other dried teas.
| Product type | Number of samples | Number of samples (%) with detected levels | Minimum (ppm) | Maximum (ppm) | Average Table Note b (ppm) |
|---|---|---|---|---|---|
| Cooking sauces | 148 | 125 (84) | 0.2 | 50 | 4.7 |
| Dried beverage mixes | 38 | 24 (63) | 0.2 | 239 | 17.8 |
| Oils and extracts | 239 | 46 (19) | 0.2 | 1000 | 46.2 |
| Spice mixes | 104 | 89 (86) | 0.8 | 2170 | 329 |
| Tea | 210 | 178 (85) | 0.2 | 1920 | 302 |
| Grand total | 739 | 462 (63) | 0.2 | 2170 | 149 |
Table Notes
- Table Note b
-
Only positive results were used to calculate the average (hazard) levels
The average coumarin concentration in cooking sauces and dried beverage mixes was 4.7 ppm and 17.8 ppm, respectively, which is low compared to other commodities tested.
Figure 1 illustrates the range of coumarin concentration detected in the survey samples by product type. High variability in the coumarin content was observed in spice mixes, tea, and oils and extracts.
Figure 1. Concentration of coumarin in survey samples by product type
Description for image
| Product type | Level of coumarin found (ppm) | Number of samples with coumarin detected at this level |
|---|---|---|
| Oils and extracts | 0 | 193 |
| Oils and extracts | 0.2 | 3 |
| Oils and extracts | 0.3 | 1 |
| Oils and extracts | 0.8 | 1 |
| Oils and extracts | 1 | 2 |
| Oils and extracts | 1.4 | 2 |
| Oils and extracts | 1.5 | 1 |
| Oils and extracts | 1.6 | 4 |
| Oils and extracts | 1.7 | 1 |
| Oils and extracts | 2 | 2 |
| Oils and extracts | 2.2 | 1 |
| Oils and extracts | 4.3 | 1 |
| Oils and extracts | 78.8 | 1 |
| Oils and extracts | 166 | 1 |
| Oils and extracts | 255 | 1 |
| Oils and extracts | 295 | 1 |
| Oils and extracts | 307 | 1 |
| Oils and extracts | 310 | 1 |
| Oils and extracts | 313 | 1 |
| Oils and extracts | 315 | 1 |
| Oils and extracts | 319 | 1 |
| Oils and extracts | 331 | 1 |
| Oils and extracts | 335 | 1 |
| Oils and extracts | 340 | 1 |
| Oils and extracts | 341 | 2 |
| Oils and extracts | 342 | 1 |
| Oils and extracts | 354 | 1 |
| Oils and extracts | 355 | 1 |
| Oils and extracts | 357 | 1 |
| Oils and extracts | 439 | 1 |
| Oils and extracts | 452 | 1 |
| Oils and extracts | 463 | 1 |
| Oils and extracts | 493 | 1 |
| Oils and extracts | 505 | 1 |
| Oils and extracts | 531 | 1 |
| Oils and extracts | 691 | 1 |
| Oils and extracts | 992 | 1 |
| Oils and extracts | 1000 | 1 |
| Cooking sauces | 0 | 23 |
| Cooking sauces | 0.2 | 1 |
| Cooking sauces | 0.3 | 3 |
| Cooking sauces | 0.5 | 4 |
| Cooking sauces | 0.6 | 7 |
| Cooking sauces | 0.7 | 3 |
| Cooking sauces | 0.8 | 1 |
| Cooking sauces | 0.9 | 4 |
| Cooking sauces | 1 | 2 |
| Cooking sauces | 1.1 | 3 |
| Cooking sauces | 1.2 | 1 |
| Cooking sauces | 1.4 | 6 |
| Cooking sauces | 1.5 | 5 |
| Cooking sauces | 1.6 | 4 |
| Cooking sauces | 1.7 | 4 |
| Cooking sauces | 1.8 | 8 |
| Cooking sauces | 1.9 | 4 |
| Cooking sauces | 2 | 2 |
| Cooking sauces | 2.1 | 2 |
| Cooking sauces | 2.2 | 3 |
| Cooking sauces | 2.3 | 1 |
| Cooking sauces | 2.4 | 2 |
| Cooking sauces | 2.5 | 1 |
| Cooking sauces | 2.6 | 4 |
| Cooking sauces | 2.7 | 1 |
| Cooking sauces | 2.9 | 1 |
| Cooking sauces | 3 | 2 |
| Cooking sauces | 3.1 | 2 |
| Cooking sauces | 3.4 | 1 |
| Cooking sauces | 3.5 | 2 |
| Cooking sauces | 3.6 | 1 |
| Cooking sauces | 3.7 | 1 |
| Cooking sauces | 3.8 | 1 |
| Cooking sauces | 3.9 | 1 |
| Cooking sauces | 4 | 2 |
| Cooking sauces | 4.1 | 2 |
| Cooking sauces | 4.4 | 1 |
| Cooking sauces | 4.5 | 1 |
| Cooking sauces | 4.8 | 1 |
| Cooking sauces | 4.9 | 1 |
| Cooking sauces | 5.9 | 2 |
| Cooking sauces | 7.3 | 1 |
| Cooking sauces | 7.7 | 1 |
| Cooking sauces | 9.8 | 1 |
| Cooking sauces | 10.7 | 1 |
| Cooking sauces | 10.9 | 2 |
| Cooking sauces | 11.1 | 1 |
| Cooking sauces | 11.2 | 1 |
| Cooking sauces | 11.6 | 1 |
| Cooking sauces | 12 | 1 |
| Cooking sauces | 13.3 | 1 |
| Cooking sauces | 13.8 | 1 |
| Cooking sauces | 14.1 | 1 |
| Cooking sauces | 14.7 | 1 |
| Cooking sauces | 15.9 | 1 |
| Cooking sauces | 16.3 | 1 |
| Cooking sauces | 16.8 | 1 |
| Cooking sauces | 17.7 | 1 |
| Cooking sauces | 17.9 | 1 |
| Cooking sauces | 19.5 | 1 |
| Cooking sauces | 20.9 | 1 |
| Cooking sauces | 21.6 | 1 |
| Cooking sauces | 22.8 | 1 |
| Cooking sauces | 33.7 | 1 |
| Cooking sauces | 40.9 | 1 |
| Cooking sauces | 49.9 | 1 |
| Cooking sauces | 50 | 1 |
| Dried beverage mixes | 0 | 14 |
| Dried beverage mixes | 0.2 | 1 |
| Dried beverage mixes | 0.3 | 2 |
| Dried beverage mixes | 0.5 | 3 |
| Dried beverage mixes | 0.6 | 1 |
| Dried beverage mixes | 0.7 | 2 |
| Dried beverage mixes | 0.8 | 1 |
| Dried beverage mixes | 1.2 | 1 |
| Dried beverage mixes | 2 | 1 |
| Dried beverage mixes | 5.7 | 1 |
| Dried beverage mixes | 7.4 | 1 |
| Dried beverage mixes | 14.5 | 1 |
| Dried beverage mixes | 18 | 1 |
| Dried beverage mixes | 21 | 1 |
| Dried beverage mixes | 23.8 | 1 |
| Dried beverage mixes | 29.5 | 1 |
| Dried beverage mixes | 39.9 | 1 |
| Dried beverage mixes | 61.1 | 1 |
| Dried beverage mixes | 84.3 | 1 |
| Dried beverage mixes | 123 | 1 |
| Dried beverage mixes | 239 | 1 |
| Spice mixes | 0 | 15 |
| Spice mixes | 0.8 | 1 |
| Spice mixes | 0.9 | 1 |
| Spice mixes | 1.4 | 1 |
| Spice mixes | 2.7 | 1 |
| Spice mixes | 2.8 | 2 |
| Spice mixes | 3.6 | 2 |
| Spice mixes | 4.3 | 1 |
| Spice mixes | 4.4 | 1 |
| Spice mixes | 5.8 | 1 |
| Spice mixes | 6.5 | 1 |
| Spice mixes | 6.8 | 1 |
| Spice mixes | 8.9 | 1 |
| Spice mixes | 15 | 1 |
| Spice mixes | 16.4 | 1 |
| Spice mixes | 17.7 | 1 |
| Spice mixes | 19.7 | 2 |
| Spice mixes | 21.9 | 1 |
| Spice mixes | 22 | 1 |
| Spice mixes | 22.7 | 1 |
| Spice mixes | 25.5 | 1 |
| Spice mixes | 25.6 | 1 |
| Spice mixes | 26.8 | 1 |
| Spice mixes | 28.3 | 1 |
| Spice mixes | 29.6 | 1 |
| Spice mixes | 32.2 | 1 |
| Spice mixes | 33.8 | 1 |
| Spice mixes | 35.8 | 1 |
| Spice mixes | 42.6 | 1 |
| Spice mixes | 48.1 | 1 |
| Spice mixes | 61.8 | 1 |
| Spice mixes | 70.7 | 1 |
| Spice mixes | 71.3 | 1 |
| Spice mixes | 74.8 | 1 |
| Spice mixes | 76.4 | 1 |
| Spice mixes | 80.1 | 1 |
| Spice mixes | 82.3 | 1 |
| Spice mixes | 88 | 1 |
| Spice mixes | 124 | 1 |
| Spice mixes | 132 | 1 |
| Spice mixes | 150 | 1 |
| Spice mixes | 153 | 1 |
| Spice mixes | 160 | 1 |
| Spice mixes | 173 | 1 |
| Spice mixes | 188 | 1 |
| Spice mixes | 190 | 1 |
| Spice mixes | 203 | 1 |
| Spice mixes | 211 | 1 |
| Spice mixes | 214 | 1 |
| Spice mixes | 227 | 1 |
| Spice mixes | 237 | 1 |
| Spice mixes | 238 | 1 |
| Spice mixes | 266 | 1 |
| Spice mixes | 275 | 1 |
| Spice mixes | 285 | 1 |
| Spice mixes | 289 | 1 |
| Spice mixes | 307 | 1 |
| Spice mixes | 343 | 1 |
| Spice mixes | 347 | 1 |
| Spice mixes | 370 | 1 |
| Spice mixes | 411 | 1 |
| Spice mixes | 419 | 1 |
| Spice mixes | 481 | 1 |
| Spice mixes | 494 | 1 |
| Spice mixes | 659 | 1 |
| Spice mixes | 662 | 1 |
| Spice mixes | 777 | 1 |
| Spice mixes | 821 | 1 |
| Spice mixes | 899 | 1 |
| Spice mixes | 902 | 1 |
| Spice mixes | 908 | 1 |
| Spice mixes | 922 | 1 |
| Spice mixes | 1000 | 1 |
| Spice mixes | 1020 | 2 |
| Spice mixes | 1040 | 2 |
| Spice mixes | 1050 | 1 |
| Spice mixes | 1060 | 1 |
| Spice mixes | 1080 | 1 |
| Spice mixes | 1170 | 1 |
| Spice mixes | 1210 | 1 |
| Spice mixes | 1490 | 1 |
| Spice mixes | 1570 | 1 |
| Spice mixes | 1690 | 1 |
| Spice mixes | 2070 | 1 |
| Spice mixes | 2170 | 1 |
| Tea | 0 | 32 |
| Tea | 0.2 | 2 |
| Tea | 0.3 | 1 |
| Tea | 0.4 | 2 |
| Tea | 0.5 | 4 |
| Tea | 0.9 | 1 |
| Tea | 1.2 | 1 |
| Tea | 1.3 | 1 |
| Tea | 2 | 1 |
| Tea | 3.5 | 1 |
| Tea | 4.3 | 1 |
| Tea | 5.1 | 2 |
| Tea | 6.6 | 1 |
| Tea | 6.8 | 1 |
| Tea | 7.6 | 1 |
| Tea | 7.8 | 1 |
| Tea | 8.1 | 1 |
| Tea | 8.4 | 1 |
| Tea | 9 | 2 |
| Tea | 9.9 | 1 |
| Tea | 10.2 | 1 |
| Tea | 10.3 | 2 |
| Tea | 11.4 | 1 |
| Tea | 12.2 | 1 |
| Tea | 12.3 | 1 |
| Tea | 13.3 | 1 |
| Tea | 13.4 | 1 |
| Tea | 13.9 | 1 |
| Tea | 14 | 1 |
| Tea | 14.6 | 1 |
| Tea | 15 | 1 |
| Tea | 15.8 | 1 |
| Tea | 17.3 | 1 |
| Tea | 17.4 | 1 |
| Tea | 18.9 | 1 |
| Tea | 19.1 | 1 |
| Tea | 19.3 | 1 |
| Tea | 22.6 | 1 |
| Tea | 22.8 | 1 |
| Tea | 23.2 | 1 |
| Tea | 27.5 | 1 |
| Tea | 30.9 | 1 |
| Tea | 33.1 | 1 |
| Tea | 34.5 | 1 |
| Tea | 34.9 | 1 |
| Tea | 35.4 | 1 |
| Tea | 51.1 | 1 |
| Tea | 60.9 | 1 |
| Tea | 66 | 1 |
| Tea | 73.1 | 1 |
| Tea | 73.3 | 1 |
| Tea | 77.5 | 1 |
| Tea | 78.6 | 1 |
| Tea | 93 | 1 |
| Tea | 93.5 | 1 |
| Tea | 93.9 | 1 |
| Tea | 97.6 | 1 |
| Tea | 99.8 | 1 |
| Tea | 107 | 1 |
| Tea | 112 | 1 |
| Tea | 119 | 1 |
| Tea | 120 | 1 |
| Tea | 121 | 2 |
| Tea | 122 | 2 |
| Tea | 126 | 1 |
| Tea | 132 | 1 |
| Tea | 134 | 1 |
| Tea | 135 | 1 |
| Tea | 142 | 1 |
| Tea | 143 | 1 |
| Tea | 146 | 1 |
| Tea | 150 | 1 |
| Tea | 154 | 1 |
| Tea | 162 | 1 |
| Tea | 180 | 1 |
| Tea | 186 | 1 |
| Tea | 189 | 1 |
| Tea | 190 | 1 |
| Tea | 191 | 1 |
| Tea | 192 | 1 |
| Tea | 199 | 1 |
| Tea | 202 | 1 |
| Tea | 203 | 1 |
| Tea | 207 | 1 |
| Tea | 210 | 2 |
| Tea | 223 | 1 |
| Tea | 226 | 1 |
| Tea | 227 | 1 |
| Tea | 233 | 1 |
| Tea | 235 | 1 |
| Tea | 237 | 1 |
| Tea | 246 | 1 |
| Tea | 260 | 1 |
| Tea | 262 | 1 |
| Tea | 267 | 1 |
| Tea | 269 | 1 |
| Tea | 273 | 1 |
| Tea | 279 | 1 |
| Tea | 290 | 1 |
| Tea | 291 | 1 |
| Tea | 293 | 1 |
| Tea | 297 | 1 |
| Tea | 310 | 1 |
| Tea | 314 | 1 |
| Tea | 315 | 1 |
| Tea | 323 | 1 |
| Tea | 325 | 2 |
| Tea | 338 | 1 |
| Tea | 339 | 2 |
| Tea | 347 | 1 |
| Tea | 362 | 1 |
| Tea | 370 | 1 |
| Tea | 387 | 1 |
| Tea | 408 | 1 |
| Tea | 416 | 1 |
| Tea | 421 | 1 |
| Tea | 424 | 1 |
| Tea | 445 | 1 |
| Tea | 453 | 1 |
| Tea | 497 | 2 |
| Tea | 505 | 1 |
| Tea | 520 | 2 |
| Tea | 536 | 1 |
| Tea | 546 | 1 |
| Tea | 560 | 1 |
| Tea | 602 | 1 |
| Tea | 614 | 1 |
| Tea | 620 | 1 |
| Tea | 621 | 1 |
| Tea | 628 | 1 |
| Tea | 638 | 1 |
| Tea | 680 | 1 |
| Tea | 691 | 1 |
| Tea | 712 | 1 |
| Tea | 743 | 1 |
| Tea | 750 | 1 |
| Tea | 753 | 1 |
| Tea | 850 | 1 |
| Tea | 853 | 1 |
| Tea | 877 | 1 |
| Tea | 893 | 1 |
| Tea | 903 | 1 |
| Tea | 944 | 1 |
| Tea | 975 | 1 |
| Tea | 983 | 1 |
| Tea | 988 | 1 |
| Tea | 1010 | 1 |
| Tea | 1050 | 1 |
| Tea | 1100 | 1 |
| Tea | 1110 | 1 |
| Tea | 1130 | 2 |
| Tea | 1260 | 1 |
| Tea | 1380 | 1 |
| Tea | 1390 | 1 |
| Tea | 1420 | 1 |
| Tea | 1490 | 1 |
| Tea | 1500 | 2 |
| Tea | 1630 | 1 |
| Tea | 1650 | 1 |
| Tea | 1660 | 1 |
| Tea | 1900 | 1 |
| Tea | 1920 | 1 |
All cinnamon oils and extracts contained coumarin, with levels up to 1000 ppm and an average level of 281 ppm. Vanilla extracts included pure and artificial vanilla and most did not contain detected levels of coumarin. Only seven out of 200 samples of vanilla extracts contained detected amount of coumarin at low levels ranging from 0.2 ppm to 4.3 ppm. One sample of mixed cinnamon/vanilla extract tested contained 78.8 ppm.
What do the survey results mean
The samples tested show a wide range of coumarin content which agrees with data in the scientific literature and previous surveys resultsFootnote 7,Footnote 8,Footnote 9. The wide range of coumarin content found in these foods is due to natural variation, degree of processing, the cinnamon content and the type of cinnamon used in these foods.
The average and maximum coumarin concentration in dried beverage mixes, spice mixes and tea were comparable to previous targeted surveys. Considering the high cinnamon content of the food groups tested, the coumarin levels found are within the range reported in literature of up to 9090 ppm in pure Cassia cinnamonFootnote 10. The average coumarin levels found in these food commodities also compare well with the literature as reported in Table 3. Some differences observed are likely due to the sample size and the specific type of product tested.
The percentage of dried beverage mix, spice mix and tea samples with detected levels of coumarin in the 2013 to 2014 survey was 66%, 87% and 99%, respectively. These numbers are in close agreement with the results of this 2014 to 2015 survey of 63%, 86% and 85%, respectively.
HC's Bureau of Chemical Safety determined the levels of coumarin in food observed in this survey are not expected to pose a concern to human health, therefore no follow-up actions were required.
| Product type | Study | Year | Number of samples | Minimum (ppm) | Maximum (ppm) | Average (ppm) |
|---|---|---|---|---|---|---|
| Ground cinnamon | CFIA SurveyTable Note e | 2011-2012 | 87 | 16.2 | 7816 | 3594 Table Note c |
| Ground cinnamon | BlahováTable Note i | 2012 | 60 | 2650 | 7057 | 3856 |
| Cinnamon powder and sticks | KrugerTable Note j | 2018 | 28 | 8 | 5017 | 1449 |
| Cinnamon cassia powder and sticks | WoehrlinTable Note h | 2010 | 69 | <LOD | 9900 | 3697 |
| Cinnamon powder | LungariniTable Note d | 2008 | 20 | 5 | 3094 | 1456 |
| Cooking sauce | CFIA Survey | 2014-2015 | 148 | 0.2 | 50 | 4.7 Table Note c |
| Cooking sauce | FSATable Note k | 2015 | 13 | 1.10 | 6.10 | 3.26 |
| Dried beverage mix | CFIA Survey | 2014-2015 | 38 | 0.2 | 239 | 17.8 Table Note c |
| Dried beverage mix | CFIA SurveyTable Note g | 2013-2014 | 32 | 0.2 | 217 | 45.4 Table Note c |
| Oil/extract | CFIA Survey | 2014-2015 | 239 | 0.2 | 1000 | 46.2 Table Note c |
| Cassia leaf oil | ChangTable Note l | 2001 | 2 | 0 | 2600 | 2600 |
| Spice mix | CFIA Survey | 2014-2015 | 324 | 0.2 | 2170 | 329 Table Note c |
| Spice mix | CFIA SurveyTable Note g | 2013-2014 | 103 | 0.2 | 2510 | 390 Table Note c |
| Spice mix | CFIA SurveyTable Note f | 2012-2013 | 53 | 30 | 3078 | 568 Table Note c |
| Spice mix | CFIA SurveyTable Note l | 2011-2012 | 24 | <0.29 | 2014 | 352 Table Note c |
| Spice mix | RatersTable Note m | 2008 | 172 | <0.03 | 4309 | 174 |
| Tea | CFIA Survey | 2014-2015 | 508 | 0.2 | 1920 | 302 Table Note c |
| Tea | CFIA SurveyTable Note g | 2013-2014 | 115 | 0.3 | 2430 | 500 Table Note c |
| Tea | CFIA SurveyTable Note e | 2011 - 2012 | 11 | <0.29 | 1040 | 380 Table Note c |
| Tea | KrugerTable Note j | 2018 | 8 | 20 | 137 | 62 |
| Tea | LungariniTable Note d | 2008 | 5 | 30 | 192 | 81 |
Table Notes
- Table Note c
-
Only positive results were used to calculate the average (hazard) levels
- Table Note d
-
Lungarini, S., Aureli, F., Coni, E. (2008). Coumarin and cinnamaldehyde in cinnamon marketed in Italy: A natural chemical hazard? Food Additives and Contaminants. 25(11), pp. 1297-1305.
- Table Note e
-
2011-2012 Coumarin in Cinnamon and Cinnamon-Containing Products. (2018). Canada. Canadian Food Inspection Agency.
- Table Note f
-
2012-2013 Coumarin in Cinnamon and Cinnamon-Containing Products. (2018). Canada. Canadian Food Inspection Agency.
- Table Note g
-
2013-2014 Coumarin in Dried Beverages, Breads, Baking Mixes, Spice Mixes, Dried Tea, Baked Goods, and Breakfast Foods. (2018). Canada. Canadian Food Inspection Agency.
- Table Note h
-
Woehrlin, F., Hildburg, F., Abraham, K., Preiss-Weigert, P. (2010). Quantification of Flavoring Constituents in Cinnamon: High Variation of Coumarin in Cassia Bark from the German Retail Market and in Authentic Samples from Indonesia. J. Agric. Food Chem. 58(19), pp. 10568–10575.
- Table Note i
-
Blahova, J., Svobodova, Z. (2012). Assessment of coumarin levels in ground cinnamon available in the Czech retail market. Scientific World Journal. pp. 263851.
- Table Note j
-
Krüger, S., Winheim, L., Morlock G.E. (2017). Planar chromatographic screening and quantification of coumarin in food, confirmed by mass spectrometry. Food Chemistry. 239, pp. 1182-1191.
- Table Note k
-
Survey on the Consumption of Cinnamon-Containing Foods and Drinks by the UK Population (Apekey , T.A., Khokhar, S.) School of Food Science & Nutrition, University of Leeds. (2015). Food Standards Agency.
- Table Note l
-
Chang, S.T., Chen, P.F., Chang , S.C. (2001). Antibacterial activity of leaf essential oils and their constituents from Cinnamomum osmophloeum. J. Ethnopharmacol. 77, pp. 123-127.
- Table Note m
-
Raters, M., Matissek, R. (2008). Analysis of coumarin in various foods using liquid chromatography with tandem mass spectrometric detection. European Food Research and Technology. 228, pp. 637-642.
- Date modified: